Study Guide
Field 232: Multi-Subject: Teachers of Middle Childhood
(Grade 5–Grade 9)
Part Two: Mathematics
Recommendation for individuals using a screenreader: please set your punctuation settings to "most."
Sample Selected-Response Questions
The following reference material will be available to you during the test:
Competency 0001
Number Systems
1. A student approximates
 as
4 and 159 over 200 .
Which value is closest to the error of this approximation?
- 0.000831
- 0.000832
- 0.795831
- 0.795832
- Enter to expand or collapse answer. Answer expanded
- Correct Response: B. This question requires the examinee to apply knowledge of numbers that are not rational and find rational approximations of irrational numbers. Using a calculator, the square root of 23 equals 4.795832, rounded to six decimal places. Converting 159 over 200 to thousandths, 4 and 159 over 200 equals 4.795. Subtracting 4.795832 minus 4.795finds an error of 0.000832.
2. start bold Use the table below to answer the question that follows. end bold
x f of x 0 4 1 13 2 22 3 31
A linear function, f of x is used to generate the table shown. Which value is equal to f of negative 1 ?
- 3
- 0
- negative 5
- negative 9
- Enter to expand or collapse answer. Answer expanded
- Correct Response: C. This question requires the examinee to generate and analyze patterns and relationships. In the table shown, for every increase of 1 in the x column, the f of x column increases by 9. Subtract 9 from 4 to get the value of f of negative 1 colon 4 minus 9 equals negative 5
Competency 0002
Algebra and Functions
3. start bold Use the table below to answer the question that follows. end bold
Altitude Above Sea Level (miles) Percentage of Oxygen Available for Breathing 0 100 percent 10 11 percent
The table shows the percentage of oxygen available for breathing at two different altitudes above sea level. One model for determining the percentage of oxygen available for breathing as a function of the altitude above sea level is P left paren h right paren equals 100 e sup negative 0.22 h where P left paren h right paren is the percentage of oxygen available for breathing and h is the altitude in miles above sea level. If a linear function is also used to model the data, how do the predictions made for the percentage of oxygen available for breathing by the two models compare at an altitude of 5 miles above sea level?
- A linear model predicts a value of about 1.1 percentage points less than the exponential model.
- A linear model predicts a value of about 8.9 percentage points less than the exponential model.
- A linear model predicts a value of about 22 percentage points greater than the exponential model.
- A linear model predicts a value of about 33 percentage points greater than the exponential model.
- Enter to expand or collapse answer. Answer expanded
- Correct Response: C. This question requires the examinee to construct and compare linear and exponential models. To construct a linear model, use slope = 11 minus 100 over 10 minus 0 equals negative 8.9 and intercept left paren 0 comma 100 right paren, so P left paren h right paren equals negative 8.9 h plus 100 and P left paren 5 right paren equals negative 8.9 left paren 5 right paren plus 100 equals 55.5 percent Using the given exponential model, P left paren 5 right paren equals 100 e sup negative 0.22 left paren 5 right paren so the linear model predicts a value about 22 percentage points greater than the exponential model.
4. start bold Use the piecewise defined function below to answer the question that follows. end bold
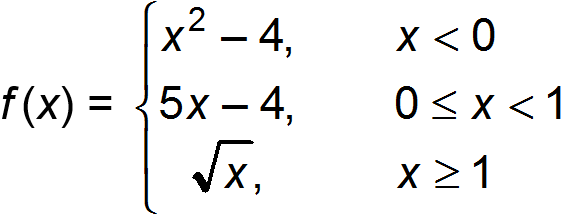
f of x equals open brace x squared minus 4 when x is less than 0, 5 x minus 4 when 0 is less than or equal to x which is less than 1, the square root of x when x is greater than or equal to 1
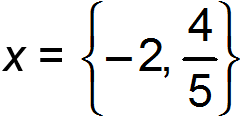
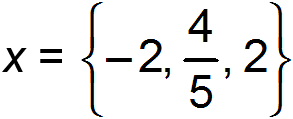
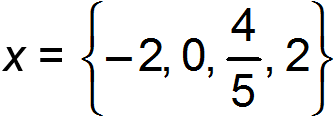
The x-intercepts of the piecewise defined function shown are best represented by which set?
-
- x equals open brace negative 2 comma 0 comma 2 close brace
-
-
- Enter to expand or collapse answer. Answer expanded
-
Correct Response: A. This question requires the examinee to analyze functions using different representations. To find an x-intercept, set the
f of x
value equal to 0 and solve for x. The piecewise defined function will be graphed using the function
f of x equals x squared minus 4
for all negative values of x.
The function
f of x equals x squared minus 4 equals open paren x minus 2 close paren open paren x plus 2 close paren
will have an x-intercept at
the point negative 2 comma 0
in this interval. The function
f of x equals 5 x minus 4
is graphed from
x equals 0
up to
x equals 1
In this interval,
f of x equals 5 x minus 4
will have an x-intercept at
 .
The third part of the piecewise defined function,
f of x equals the square root of x,
is graphed using x values larger than 1 and does not have an x-intercept in that interval. The x-intercepts of
f of x
are
negative 2
and
4 fifths .
Competency 0003
Measurement, Geometry, Statistics, and Probability
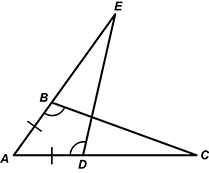
5. start bold Use the diagram below to answer the question that follows. end bold
two triangles that share a vertex triangle a b c has its longest side a c laying horizontally with a being the bottom left vertex c being the bottom right vertex and b being the top vertex the second triangle a e d is more vertical with a being the bottom left vertex d being the bottom right vertex and e being the top vertex side a e is a continuation of side a b from triangle a b c vertex d is located between a and c on triangle a b c side a b is congruent to side a d and angle a b c is congruent to angle a d e.
Given: line segment A B is congruent to line segment A D and angle A B C is congruent to angle A D E
A student wants to use a triangle angle-side relationship and the given information to prove that triangle A E D is congruent to triangle A C B Some of the statements made by the student are shown below.
- line segment A B is congruent to line segment A D
- This statement is missing.
- triangle A E D is congruent to triangle A C B.
Which equivalence represents the missing statement for line 3?
- AE
 AC.
AC. -
 EAC
EAC

 CAE.
CAE. - BC
 DE.
DE. -
 BCA
BCA

 DEA.
DEA.
- Enter to expand or collapse answer. Answer expanded
- Correct Response: B. This question requires the examinee to analyze the proof of a theorem about triangles. Given the pair of congruent angles and the pair of congruent sides, the choices are to use either angle-side-angle or side-angle-side to prove the required triangles congruent. Since the triangles overlap, they share angle A, and angle E A C is congruent to angle C A E by the reflexive property, making the triangles congruent by angle-side-angle.
6. A certain vase contains 5 red cubes and 3 blue cubes, and another vase contains 2 red cubes and 4 blue cubes. One of the two vases is randomly chosen, and then one cube is randomly pulled from that vase. Which tree diagram can be used to find the probability that the chosen cube is red?
-
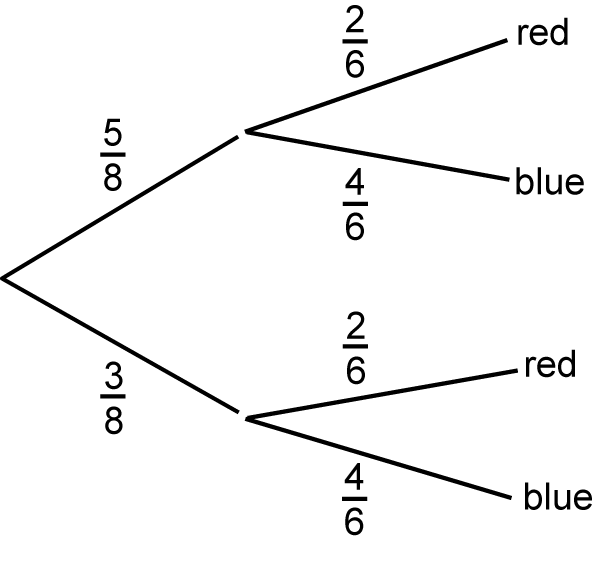
A tree diagram is shown. The first 2 branches are labeled 5 eighths and 3 eighths. The 5 eighths branch extends to 2 branches, labeled 2 sixths and 4 sixths. The 2 sixths branch ends with the label red and the 4 sixths branch ends with the label blue. The 3 eighths branch extends to 2 branches labeled 2 sixths and 4 sixths. The 2 sixths branch ends with the label red and the 4 sixths branch ends with the label blue.
-
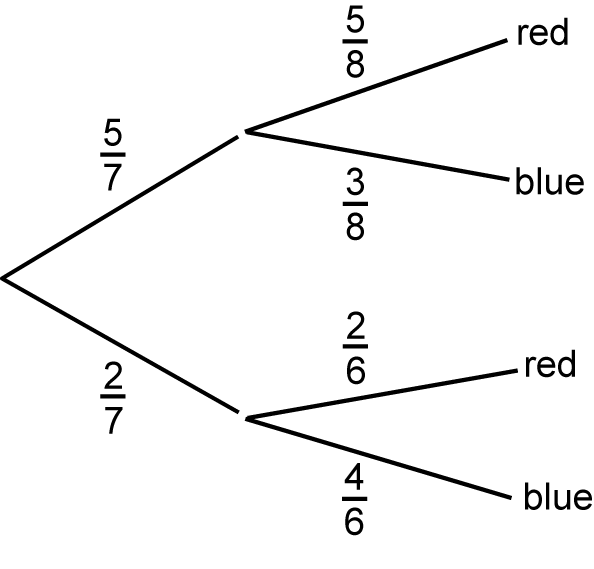
A tree diagram is shown. The first 2 branches are labeled 5 sevenths and 2 sevenths. The first 5 sevenths branch extends to 2 branches, labeled 5 eighths and 3 eighths. The 5 eighths branch ends with the label red and the 3 eighths branch ends with the label blue. The 2 sevenths branch extends to 2 branches labeled 2 sixths and 4 sixths. The 2 sixths branch ends with the label red and the 4 sixths branch ends with the label blue.
-
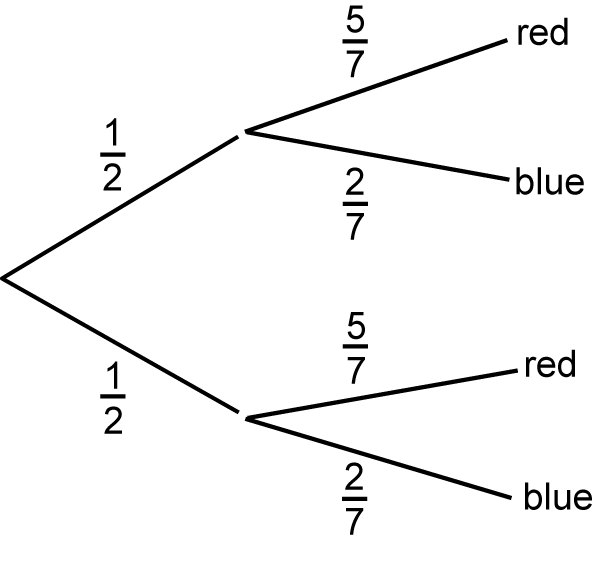
A tree diagram is shown. The first 2 branches are labeled 1 half and 1 half. The first 1 half branch extends to 2 branches, labeled 5 sevenths and 2 sevenths. The 5 sevenths branch ends with the label red and the 2 sevenths branch ends with the label blue. The second 1 half branch extends to 2 branches labeled 5 sevenths and 2 sevenths. The 5 sevenths branch ends with the label red and the 2 sevenths branch ends with the label blue.
-
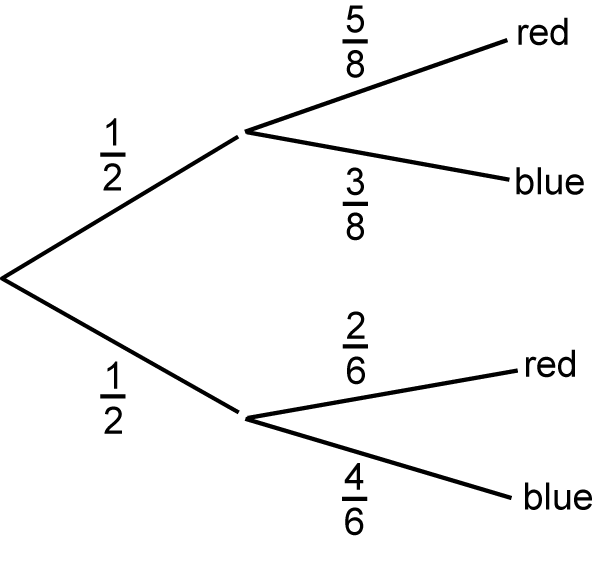
A tree diagram is shown. The first 2 branches are labeled 1 half and 1 half. The first 1 half branch extends to 2 branches, labeled 5 eighths and 3 eighths. The 5 eighths branch ends with the label red and the 3 eighths branch ends with the label blue. The second 1 half branch extends to 2 branches labeled 2 sixths and 4 sixths. The 2 sixths branch ends with the label red and the 4 sixths branch ends with the label blue.
- Enter to expand or collapse answer. Answer expanded
- Correct Response: D. This question requires the examinee to evaluate probability models. A probability tree diagram has probabilities written on the branches and the outcomes written at the ends. The first set of branches shows the probability of choosing each vase. Since there are two vases to choose from, the probability of choosing a vase is 1 half. The next set of branches shows the probability of choosing either a red or a blue cube from the chosen vase. The first vase has 5 red and 3 blue cubes, so the probability of choosing a red cube from the first vase is 5 eighths and the probability of choosing a blue cube from that vase is 3 eighths The second vase has 2 red and 4 blue cubes, so the probability of choosing a red cube from the second vase is 2 sixths and the probability of choosing a blue cube from that vase is 4 sixths The tree diagram that can be used to find the probability of choosing a red cube is D.

 = 4.795832,
 ,
,